I'm preparing to do some simple MongoDB hackathons in Scandinavia, and because I don't want to forget how to do all the steps, I actually wrote down an example exercise. This is a simple and fun exercise just to get some data into MongoDB and then get it out again. We're going to use some awesome JavaScript tools for the out part: Node.js and Crest for a simple HTTP API, and Angular.js to draw the pretty pictures. So this is not just a MongoDB hackathon but more like a fullstack JavaScript or MEAN hackathon. (Strictly speaking there's no Express.js, so maybe this is a NMCA hackathon?)
Install MongoDB
The usual apt, yum and brew methods will work for this tutorial. If you're not fully committed to MongoDB just yet, you can also download the zip file, unpack it and just run:
bin/mongod --dbpath .The fine manual has the details.
Get some data
This is the fun part, and I encourage you to Bring Your Own Data. Here are just some examples of open data sets that work well for this kind of tutorial:
- Helsinki Region Infosharing
- Open Stockholm (data)
- CIA World Factbook open data sets
- World Bank open data
- Twitter API Note, feeding tweets into MongoDB used to be cool, and it's a JSON API even, but now you need to register for OAuth keys, which is annoying for a quick hackathon.
- Gomashup list of free data feeds (often JSON)
- OpenStreetMap Overpass API
- Formula 1 stats
etc... For this example, I've used the first table in the excel file found here: https://www.hri.fi/fi/data/helsingin-ja-helsingin-seudun-vaestoennuste-… (I've attached it to this blog post in CSV format for your convenience.)
Getting data into MongoDB
This will be different depending on the data you want to insert. If you have a file that is comma separated (csv), tab separated (tsv) or json, then you are in luck, because mongoimport is an easy way to feed it into MongoDB:
mongoimport --headerline --type tsv --db hackathon --collection hki2050 hki2050.csv
Check that data is in MongoDB
$ mongo hackathon
MongoDB shell version: 2.6.4
connecting to: hackathon
sputnik-rs:PRIMARY> db.hki2050.find().pretty()
{
	"_id" : ObjectId("53edc731a3ba2c0df4ad9847"),
	"Vuosi" : 2014,
	"Väestö" : 612664,
	"0-14" : 84154,
	"0-14 %" : 13.7,
	"15-29" : 135934,
	"15-29 %" : 22.2,
	"30-44" : 139432,
	"30-44 %" : 22.8,
	"45-59" : 119136,
	"45-59 %" : 19.5,
	"60-74" : 92241,
	"60-74 %" : 15.1,
	"75+" : 41767,
	"75+ %" : 6.8
}
...
Install Node.js
To install Node, once again you'll be fine for this exercise just installing whatever is in your apt, yum or brew repository. Another popular way to install node, and to get the guaranteed latest version is using this shell script. It will install Node and NPM under ~/local/.
...and install Crest
You can install Crest as an NPM module (See README) but in this exercise we will use my own fork from github. The standard Crest doesn't support using aggregation queries, so I've added them to my own fork. Hopefully one day they will be supported.
git clone https://github.com/henrikingo/crest.git
cd crest
npm install # Install modules listed in package.json
bin/crest
(Note, if you are using anything else than the above forked Crest repo, you need to check or remove the username and password lines from config.json.)
Test the HTTP API
The last command above should have started a Crest server on localhost:3500. Now if you go with a browser to https://localhost:3500/hackathon/hki2050 (Replace "hackathon" and "hki2050" with your own db name and collection name.) ...you will see the collection we imported above. Crest modifies the MongoDB "_id" fields to just "id" and also converts the ObjectId() to just strings. You can use these id values in the GET request url. For example, one of my documents has the id "53edc731a3ba2c0df4ad9847". So I can open this in my browser: https://localhost:3500/hackathon/hki2050/53edc731a3ba2c0df4ad9847 which gives me my first line of population statistics as a json document:
{"Vuosi":2014,
 "Väestö":612664,
 "0-14":84154,
 "0-14 %":13.7,
 "15-29":135934,
 "15-29 %":22.2,
 "30-44":139432,
 "30-44 %":22.8,
 "45-59":119136,
 "45-59 %":19.5,
 "60-74":92241,
 "60-74 %":15.1,
 "75+":41767,
 "75+ %":6.8,
 "id":"53edc731a3ba2c0df4ad9847"}
(Linebreaks added, the browser has just one line.)
Angular.js with d3.js graphs
With our open dataset available over a HTTP REST API, it's time for the pretty pictures! For simplicity, we do not download or install any of these JS libraries, we just link directly to where they were born. There's a gotcha: When combining Angular and D3, you need to go with the D3 library first. So we'll add that to the html head:
<link href="https://nvd3.org//assets/css/nv.d3.css" rel="stylesheet" />
<script src="https://nvd3.org//assets/lib/d3.v3.js"></script>
<script src="https://nvd3.org//assets/js/nv.d3.js"></script>
Then Angular:
<script src="https://ajax.googleapis.com/ajax/libs/angularjs/1.2.22/angular.js"></script>
Then the ring to bind them together. Yes, there is an Angular module which wraps the cool D3.js graphing library into Angular directives. It is called, well, angularjs-nvd3-directives.
<script src="https://cmaurer.github.io/angularjs-nvd3-directives/
lib/angularjs-nvd3-directives/dist/angularjs-nvd3-directives.js"></script>
(The above is a single line, delete the line break.)
First Angular code
Great, we're ready to go. Add one more script tag to point to your own js file.
<script src="hackathon.js"></script>
We will introduce the client side code in 5 steps. At first, let's just see that Angular works. Create a simple Hello World Angular app:
Angular step 1: Hello World
var app = angular.module('hackathonApp', []);
app.controller('HackathonCtrl', function($scope) {
  $scope.audience = "World";
});
As this is a quick hackathon, I'm not gonna rant about everything the above does. Read a good Angular.js tutorial to learn more about apps, controllers, models, views and data binding. Then make following changes to our HTML:
<html ng-app="hackathonApp">
<head>
 ...
</head>
<body ng-controller="HackathonCtrl">
  <p>Hello {{audience}}!
</body> </html> As you can see, Angular works by introducing its own attributes into the HTML elements (body and html above, we'll use more soon) as well as using {{curly bracketed tags}} for dynamic values.
Angular step 2: Show some real data
Now, let's try to actually show some json data. As a first step, justcopy paste a few documents from MongoDB into your javascript code. Minw looks like:
var testdata = [{"Vuosi":2014,"Väestö":612664,"0-14":84154,"0-14 %":13.7,
"15-29":135934,"15-29 %":22.2,"30-44":139432,"30-44 %":22.8,"45-59":119136,
"45-59 %":19.5,"60-74":92241,"60-74 %":15.1,"75+":41767,"75+ %":6.8,
"id":"53edc731a3ba2c0df4ad9847"},
{"Vuosi":2015,"Väestö":621771,"0-14":86251,"0-14 %":13.9,"15-29":136493,
"15-29 %":22,"30-44":143233,"30-44 %":23,"45-59":119273,"45-59 %":19.2,
"60-74":93649,"60-74 %":15.1,"75+":42871,"75+ %":6.9,"id":"53edc731a3ba2c0df4ad9848"},
{"Vuosi":2016,"Väestö":631053,"0-14":88392,"0-14 %":14,"15-29":137157,"15-29 %":21.7,
"30-44":147175,"30-44 %":23.3,"45-59":119277,"45-59 %":18.9,"60-74":95526,
"60-74 %":15.1,"75+":43527,"75+ %":6.9,"id":"53edc731a3ba2c0df4ad9849"},
{"Vuosi":2017,"Väestö":637597,"0-14":90388,"0-14 %":14.2,"15-29":136537,
"15-29 %":21.4,"30-44":150232,"30-44 %":23.6,"45-59":118846,"45-59 %":18.6,
"60-74":96157,"60-74 %":15.1,"75+":45437,"75+ %":7.1,"id":"53edc731a3ba2c0df4ad984a"}];
Then change the controller code to:
var app = angular.module('hackathonApp', []);
app.controller('HackathonCtrl', function($scope, $http) {
  $scope.results = testdata;
  $scope.keys = Object.keys($scope.results[0]);
});
We can now use the variables results and keys to print the above data in simple tabular form in HTML:
  <table border="1">
    <tr>
      <td ng-repeat="key in keys">{{key}}</td>
    </tr>
    <tr ng-repeat="doc in results">
      <td ng-repeat="key in keys">{{doc[key]}}</td>
    </tr>
  </table>
This should print the first few lines of a HTML table with your data.
Angular step 3: fetching data with $http service
If you got as far as the above, it's time to plug the client into the real data source coming from the HTTP REST API. It's as simple as:
var app = angular.module('hackathonApp', []);
app.controller('HackathonCtrl', function($scope, $http) {
  $http.get('https://127.0.0.1:3500/hackathon/hki2050').success(
     function(data, status, headers, config) {
       $scope.results = data;
       $scope.keys = Object.keys($scope.results[0]);
     });
});
Note that you need to add $http into the function arguments!
Interlude: enjoy what you've achieved so far!
Before the grande finale, now is a good time to take a step back and enjoy the great progress you've made so far. You've used several contemporary and cool technologies to:
- Download an Excel table (in this example, from Helsinki Region Infosharing web site)
- convert it to csv
- convert that to json
- import it to MongoDB
- export it over HTTP REST interface (with Node)
- fetch data into the web browser with Angular
- Print it as a HTML table
In other words, you've used lots of fancy technology, to convert a data table that was formerly available in table format on the internet, and made it available in table format on the internet!
Angular/D3 step 4: Some data massaging
Nvd3 expects data in this format:
[ { "key" : "Series 1",
    "values" : [ [x1, y1], [x2, y2], ... ]
  },
  {  "key" : "Series 2",
     "values" : ...
  ...
]
It's likely that your data isn't exactly in that format. There are multiple ways you could fix that:
- Use MongoDB aggregation framework to output result sets in the needed format
- Add some middleware code to the Crest HTTP API to transform the data into the needed format. (Possibly in combination with using aggregation framework.)
- There are some hooks in Nvd3 that could be used to adapt to data that has another structure. (But I have no idea how to use them.)
- You could just write a little javascript function into the Angular controller to massage the data into the needed structure.
For a quick hack, I'll of course do the last one:
// Need to convert HTTP data to what nvd3-chart-directives expects:
// [ { key : "Series 1", values : ...}, { key : "Series 2", values : ... }, ... ]
function convertHttpToNvd3(data){
  var res = [{ "key" : "0-14", "values" : []},
             { "key" : "15-29", "values" : []},
             { "key" : "30-44", "values" : []},
             { "key" : "45-59", "values" : []},
             { "key" : "60-74", "values" : []},
             { "key" : "75+", "values" : []} ];
  for(doc in data){
    res[0]["values"].push( [ data[doc]["Vuosi"],  data[doc]["0-14"] ] );
    res[1]["values"].push( [ data[doc]["Vuosi"], data[doc]["15-29"] ] );
    res[2]["values"].push( [ data[doc]["Vuosi"], data[doc]["30-44"] ] );
    res[3]["values"].push( [ data[doc]["Vuosi"], data[doc]["45-59"] ] );
    res[4]["values"].push( [ data[doc]["Vuosi"], data[doc]["60-74"] ] );
    res[5]["values"].push( [ data[doc]["Vuosi"],   data[doc]["75+"] ] );
  }
  return res;
}
Then I just call that before binding the data:
  $http.get('https://127.0.0.1:3500/hackathon/hki2050').success(
     function(data, status, headers, config) {
       data = convertHttpToNvd3(data);
       $scope.results = data;
     });
(Note that the table output stops working at this point. I used console.log() to check that my data ended up in the intended structure.)
Angular step 5: the pretty pictures!
Finally, it's time for some fancy graphics to make this look a bit more awesome! It depends on the data you're using, but for my data I want to use a stacked area chart. This is why I love the angularjs-nvd3-directives bindings. As long as I can get my data, and have it in the right structure, I just add another directive. The graph is interactive, you can drill into it, get nice tooltips with additional data, etc. It's like HTML was extended and I don't need to write a single line of code! I haven't been this excited since they invented the <BLINK> tag!!!!! To use the NVD3 angular components, we must inject nvd3ChartDirectives as a dependency into the angular app:
var app = angular.module('hackathonApp', ['nvd3ChartDirectives']);
Then add a suitable graph to the html page:
    <div>
	    <nvd3-stacked-area-chart
        	data="results"
            id="exampleId"
            showXAxis="true"
            showYAxis="true"
            width="550"
            height="400"
            margin="{left:100,top:20,bottom:20,right:0}"
            noData="Couldn't fetch the data"
            interactive="true"
            tooltips="true"
            staggerLabels="true"
            showLegend="true">
            	<svg></svg>
        </nvd3-stacked-area-chart>
    </div>
(See above link for explanations of the attributes.) 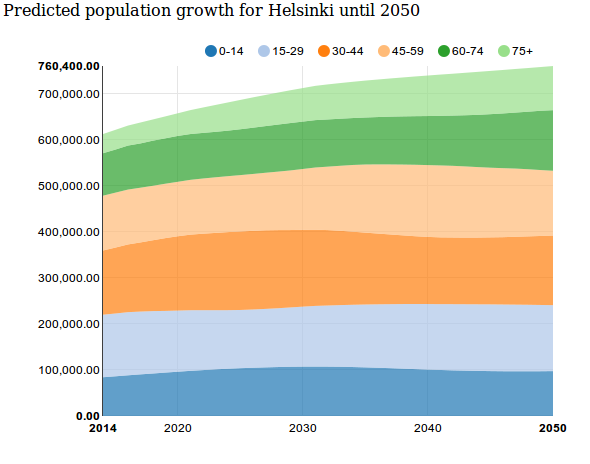
- Log in to post comments
- 106769 views