I've been promising I should re-visit once more the disk bound sysbench tests I ran on Galera. In December I finally had some lab time to do that. If you remember what troubled me then it was that in all my other Galera benchmarks performance with Galera was equal or much better compared to performance on a single MySQL node. (And this is very unusual wrt high availability solutions, usually they come with a performance penalty. This is why Galera is so great.) However, on the tests with a disk bound workload, there was performance degradation, and what was even more troubling was the performance seemed to decrease more when adding more write masters.
In these tests I was able to understand the performance decrease and it had nothing to do with Galera and not even InnoDB. It's a defect in my lab setup: all nodes kept their data on a partition mounted from an EMC SAN device - the same device for all nodes. Hence, when directing work to more nodes, and the workload is bottlenecked by disk access, naturally performance would decrease rather than increase. Unfortunately I don't currently have servers available (but will have sometime during this year) where I could re-run this same test with local disks.
As part of this lab session I also investigated the effect varying the number of Galera slave applier threads, which I will report on in the remainder of this post. Of course, the results are a bit obscure now due to the problematic lab setup wrt SAN, but I'll make some observations nevertheless.
While the previous tests were run on MySQL 5.1, this test was run on MySQL 5.5 and I will make some observations there too.
Test setup
The setup is pretty much the same as in the first benchmark. 3 nodes, 90g data, 90g buffer pool. my.cnf as it is shipped with the Galera demo distribution. The test used is oltp.lua from sysbench 0.5.
The main differences are that MySQL is version 5.5, Galera version 1.1 and Centos was upgraded to 6.0.
Single node performance
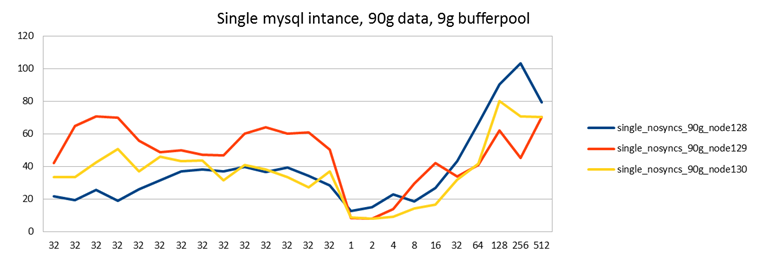
To get a baseline, I first ran sysbench against standalone MySQL nodes with wsrep_provider=none. Note that also in this test I have things like innodb_doublewrite=0 and innodb_flush_log_at_trx_commit=2. Because we will use the same settings in the Galera cluster, these results can therefore be used to demonstrate the overhead added by Galera replication. But they do not actually represent realistic settings you would use in production on a standalone MySQL node or a MySQL server using the built-in replication. Single node performance with safer (more durable) settings would probably be slower than these results (but I didn't run such tests).
As you might remember from the previous tests, MySQL showed significant warm-up effects after each restart:
The blue line is after a reboot, the red line is a second run without reboot.
To get accurate measurements I therefore now ran sysbench with 32 threads for a "long" time, before starting the actual test. In the below images I have included the warmup runs since I find them interesting, but bear in mind that the "real" benchmark starts at the right hand side where the x-axis values are 1, 2, 4...
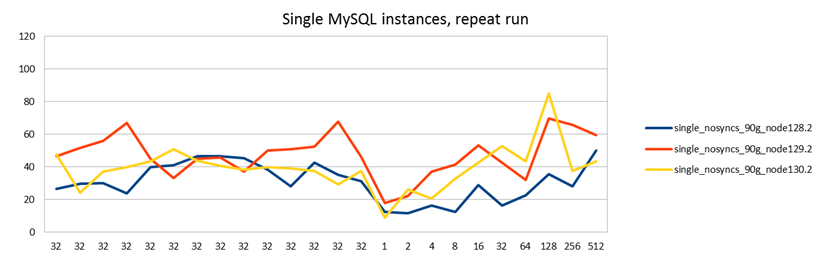
I ran this test twice to get an understanding of how variable or stable the results are:

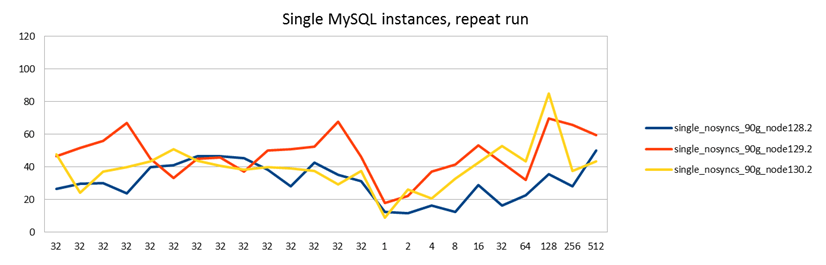
It turns out a) they are not very stable and b) the nodes are not that similar to each other. This is the mistake I made in my previous test: I only ran the single node test on one node because I thought the servers were identical. The servers are in fact identical, but not the SAN disks where the database is stored!
In this case node129 (red line) mounts the disk from one disk array, and node 128 and node130 from another one. In the first test you can see that node129 greatly benefits from having its own disk, whereas node 128 and 130 use the same device and therefore have lower performance. (The tests were run at the same time, even if they are independent.)
In the second test this is not seen. The second test was run at office time, while the first was run at midnight. I speculate that during the second test there may have been some other load on the SAN used by node129.
Another difference in these results is that the performance doesn't peak during the warm up period as it did in my earlier tests. Without investigating this any further, I'm going to guess that MySQL 5.5 shows more stable performance here than MySQL 5.1 did. (But I could be wrong. Vadim certainly was not happy with MySQL 5.5 in this regard. Otoh my measurement is slightly different, it could be I just don't see the same problem as Vadim does even if it may be present.)
3 node Galera cluster w different amount of slave threads
I then run the same test on a 3 node Galera cluster.
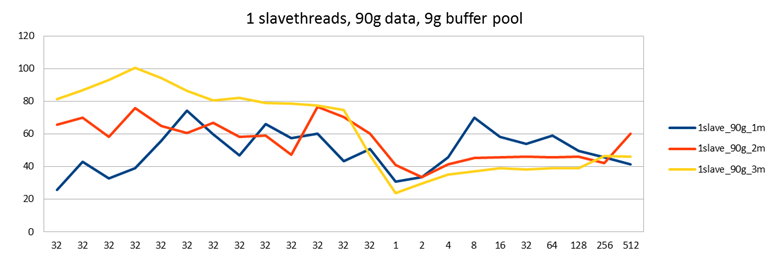
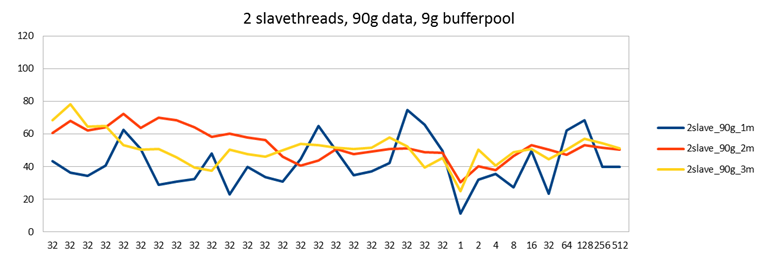
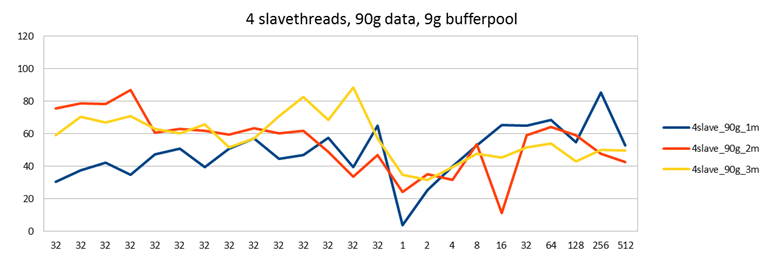
Last time I had just set the amount of slave threads to a reasonably high value of 32. This seemed to give an advantage over just one slave thread, and solved some problems early on in my tests, but I didn't try other values, I just set it to something "high enough". This time I did tests with different amount of slave threads. It seems that more is indeed better, but only slightly in this case.

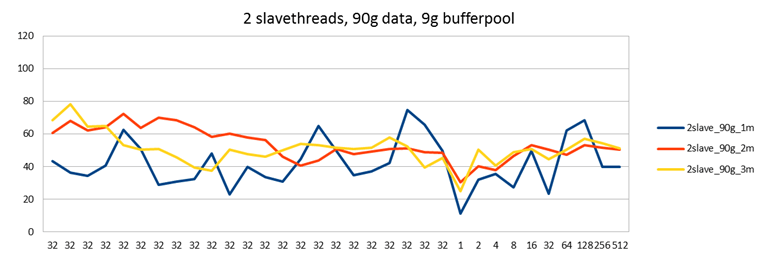
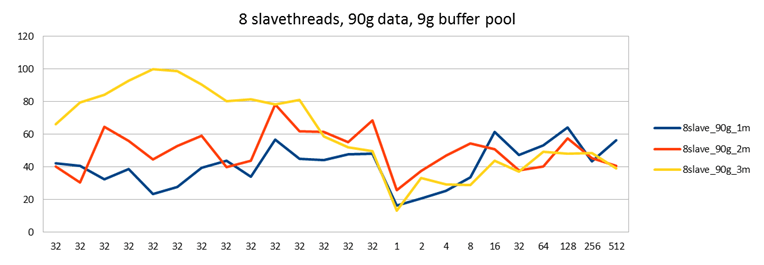
With each setting, I ran a test first directing load to a single node with two passive nodes (blue line), then directing load to two nodes with one passive node (red line) and finally directing load to all 3 nodes (yellow line).
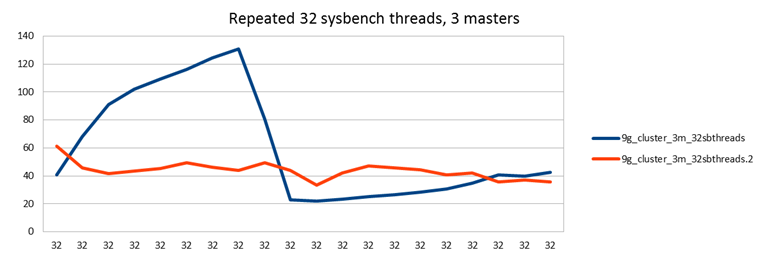
Last time I ran this test it seemed as if performance was decreasing when writing to more nodes at the same time. (Contrary to what happens with Galera in most cases, where distributing load gives you a performance increase.) Also in these tests it seems the yellow line might be slightly lower than the other two, but I can't say that the single master case would have any advantage over the test with two masters.
This can be explained by knowing that in this test node129 - the one with a separate disk - is my second master. Directing half of the work to node 129 does not decrease performance in this test. However, directing load to both node130 and node128 does decrease performance a little. This is because you now have two servers loading the same SAN disk - not good. On the other hand in the earlier test all 3 servers were setup to use the same SAN disk. Therefore with each additional write master performance would decrease.
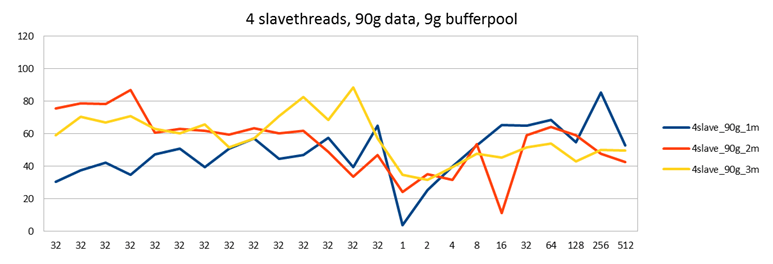
Based on the graphs here, it seems the one with 4 threads is the most optimal. Interestingly, 4 is also the number of InnoDB write and read threads I used (default settings). Maybe there is a connection, maybe not.
With a low amount of slave threads, 1 or 2 and directing all work to a single master, you can also see some unstable performance where the blue line keeps jumping up and down. This effect is not seen when you direct the work to 2 or 3 nodes though. It's nice to once see results that agree with theory. In this case theory would say that parallelizing work results in more stable performance.
I would also claim the results with 4 slave threads are at least equal to the single node case. This is an important result: Now we see that also in the disk bound workload Galera does not decrease performance compared to single node case. (And in fact, if you consider that you would run a single node with more durable settings such as innodb_flush_log_at_trx_commit=1, then Galera with less flush-heavy settings probably gives you a performance boost in most cases. And certainly if you also ran MySQL replication with sync_binlog=1, then Galera will be a big win on current MySQL versions.)
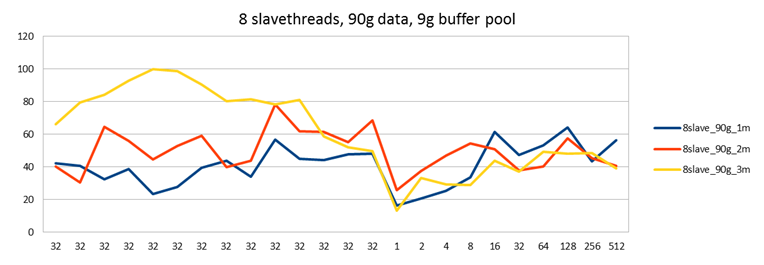
I also tried to run with 16 slave threads, but to my surprise couldn't complete this test:
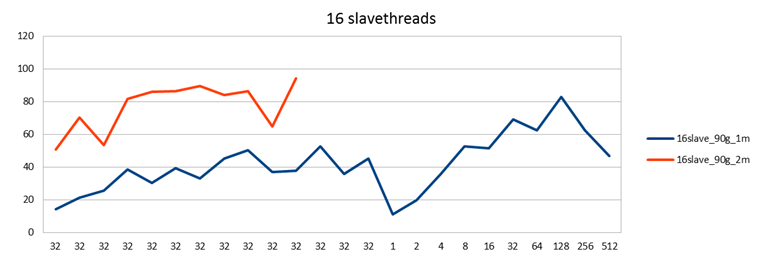
I tried several times but once the load was increasing, one of the nodes would skip heartbeats and be thrown out of the cluster. I think what happened was that under extreme disk load Linux decided to start swapping the MySQL process which therefore became unresponsive. I don't have statistics on that, but I know I had not set vm.swappiness to 0, so...
I should emphasize that Galera did function correctly in this case: One node was down and two continued to operate correctly. It's just that since the purpose was to benchmark a 3 node cluster, there was little point in continuing the test beyond this point.
PS: Did you notice that the first beta of Galera 2.0 was just announced. It comes with incremental state transfers, which means if a node was just disconnected for a short while, it can catch up by replaying the write-events missed, instead of having to copy the entire DB over again. Go check it out!
| 1slave_90g_1m | 1slave_90g_2m | 1slave_90g_3m | |
| 32 | 25.77 | 65.6 | 81.45 |
| 32 | 42.95 | 70.04 | 86.72 |
| 32 | 32.67 | 58.15 | 93.11 |
| 32 | 39.09 | 75.9 | 100.66 |
| 32 | 55.82 | 64.8 | 94.37 |
| 32 | 74.24 | 60.7 | 86.39 |
| 32 | 59.78 | 66.92 | 80.7 |
| 32 | 46.99 | 58.23 | 82.2 |
| 32 | 66.03 | 59.21 | 78.93 |
| 32 | 57.66 | 47.3 | 78.76 |
| 32 | 60.18 | 76.87 | 77.63 |
| 32 | 43.35 | 70.52 | 74.87 |
| 32 | 50.74 | 60.25 | 47 |
| 1 | 31.01 | 41.02 | 23.86 |
| 2 | 33.79 | 33.46 | 29.74 |
| 4 | 45.76 | 41.33 | 35.19 |
| 8 | 70.19 | 45.42 | 37.16 |
| 16 | 58.45 | 45.55 | 39.04 |
| 32 | 54.12 | 45.95 | 38.18 |
| 64 | 59.13 | 45.81 | 39.05 |
| 128 | 49.52 | 46.08 | 38.92 |
| 256 | 45.85 | 42.37 | 46.54 |
| 512 | 41.3 | 60.32 | 46.21 |
| 1023 | |||
| 2slave_90g_1m | 2slave_90g_2m | 2slave_90g_3m | |
| 32 | 43.5 | 60.64 | 68.28 |
| 32 | 36.53 | 68.2 | 78.34 |
| 32 | 34.56 | 62.06 | 64.48 |
| 32 | 40.77 | 64.05 | 65.02 |
| 32 | 62.78 | 72.54 | 53.12 |
| 32 | 50.75 | 63.83 | 50.52 |
| 32 | 28.8 | 69.9 | 50.94 |
| 32 | 30.66 | 68.36 | 45.67 |
| 32 | 32.29 | 63.96 | 39.65 |
| 32 | 48.22 | 58.41 | 37.58 |
| 32 | 22.89 | 60.27 | 50.53 |
| 32 | 39.7 | 57.86 | 47.82 |
| 32 | 33.66 | 56.44 | 46.32 |
| 32 | 30.99 | 46.17 | 50.13 |
| 32 | 44.63 | 40.66 | 54.01 |
| 32 | 64.89 | 43.96 | 53.08 |
| 32 | 49.54 | 50.73 | 51.67 |
| 32 | 34.85 | 47.6 | 50.76 |
| 32 | 37.28 | 49.26 | 51.47 |
| 32 | 42.34 | 50.79 | 57.96 |
| 32 | 74.87 | 51.4 | 52.27 |
| 32 | 65.82 | 48.89 | 39.34 |
| 32 | 49.67 | 48.56 | 45.41 |
| 1 | 11.26 | 30.53 | 24.83 |
| 2 | 32.1 | 40.13 | 50.58 |
| 4 | 35.6 | 37.93 | 40.84 |
| 8 | 27.49 | 46.51 | 48.68 |
| 16 | 49.68 | 53.32 | 50.77 |
| 32 | 23.22 | 50.62 | 44.39 |
| 64 | 62.31 | 47.21 | 50.29 |
| 128 | 68.64 | 53.06 | 57.29 |
| 256 | 39.95 | 51.45 | 54.31 |
| 512 | 39.72 | 50.44 | 51.25 |
| 1023 | |||
| 4slave_90g_1m | 4slave_90g_2m | 4slave_90g_3m | |
| 32 | 30.52 | 75.4 | 59.02 |
| 32 | 37.64 | 78.79 | 70.27 |
| 32 | 42.18 | 78.38 | 67.04 |
| 32 | 34.6 | 86.85 | 70.64 |
| 32 | 47.45 | 60.51 | 62.85 |
| 32 | 50.7 | 62.8 | 60.06 |
| 32 | 39.36 | 61.91 | 65.64 |
| 32 | 50.99 | 59.32 | 51.51 |
| 32 | 56.99 | 63.2 | 57.03 |
| 32 | 44.56 | 60.23 | 70.68 |
| 32 | 46.82 | 61.81 | 82.41 |
| 32 | 57.55 | 48.79 | 68.43 |
| 32 | 39.45 | 33.58 | 88.55 |
| 32 | 64.76 | 46.82 | 57.21 |
| 1 | 3.98 | 24.38 | 34.95 |
| 2 | 25.42 | 35.11 | 31.71 |
| 4 | 39.68 | 31.49 | 39.66 |
| 8 | 52.82 | 53.61 | 47.62 |
| 16 | 65.51 | 11.09 | 45.38 |
| 32 | 64.93 | 59.04 | 51.58 |
| 64 | 68.5 | 64.32 | 54.11 |
| 128 | 54.94 | 59.04 | 42.82 |
| 256 | 85.25 | 47.89 | 49.88 |
| 512 | 52.64 | 42.51 | 49.65 |
| 1023 | |||
| 8slave_90g_1m | 8slave_90g_2m | 8slave_90g_3m | |
| 32 | 42.04 | 40.43 | 65.93 |
| 32 | 40.7 | 30.37 | 79.62 |
| 32 | 32.24 | 64.68 | 84.03 |
| 32 | 38.76 | 55.74 | 92.84 |
| 32 | 23.24 | 44.4 | 99.78 |
| 32 | 27.8 | 52.71 | 98.77 |
| 32 | 39.41 | 58.93 | 90.45 |
| 32 | 43.76 | 39.83 | 80.28 |
| 32 | 34.05 | 43.69 | 81.46 |
| 32 | 56.85 | 78.41 | 78.39 |
| 32 | 44.78 | 61.89 | 80.92 |
| 32 | 43.98 | 61.23 | 58.8 |
| 32 | 47.77 | 55.27 | 52.07 |
| 32 | 48.19 | 68.3 | 49.82 |
| 1 | 16.47 | 25.9 | 13.37 |
| 2 | 20.49 | 37.52 | 33.03 |
| 4 | 25.34 | 46.95 | 29.21 |
| 8 | 33.58 | 54.31 | 28.71 |
| 16 | 61.55 | 50.93 | 43.89 |
| 32 | 47.42 | 38.07 | 37.22 |
| 64 | 53 | 40.21 | 49.23 |
| 128 | 64.07 | 57.32 | 48.09 |
| 256 | 43.5 | 45.46 | 48.41 |
| 512 | 56.48 | 40.72 | 38.93 |
| 1023 | |||
| 16slave_90g_1m | 16slave_90g_2m | ||
| 32 | 14.32 | 50.93 | |
| 32 | 21.31 | 70.59 | |
| 32 | 25.95 | 53.51 | |
| 32 | 38.55 | 81.63 | |
| 32 | 30.45 | 85.97 | |
| 32 | 39.57 | 86.59 | |
| 32 | 33.31 | 89.49 | |
| 32 | 45.36 | 83.98 | |
| 32 | 50.6 | 86.52 | |
| 32 | 37.29 | 64.82 | |
| 32 | 37.81 | 94.19 | |
| 32 | 52.97 | ||
| 32 | 36.05 | ||
| 32 | 45.29 | ||
| 1 | 11.42 | ||
| 2 | 19.97 | ||
| 4 | 35.91 | ||
| 8 | 52.7 | ||
| 16 | 51.71 | ||
| 32 | 69.08 | ||
| 64 | 62.44 | ||
| 128 | 83.15 | ||
| 256 | 62.58 | ||
| 512 | 47.01 | ||
| 1023 | |||
| single_nosyncs_90g_node128 | single_nosyncs_90g_node129 | single_nosyncs_90g_node130 | |
| 32 | 21.94 | 42.3 | 33.76 |
| 32 | 19.44 | 64.89 | 33.78 |
| 32 | 25.73 | 70.81 | 42.68 |
| 32 | 19.01 | 70.02 | 50.82 |
| 32 | 26.1 | 55.77 | 37.15 |
| 32 | 31.82 | 48.9 | 46.01 |
| 32 | 37.07 | 49.89 | 43.2 |
| 32 | 38.3 | 47.24 | 43.77 |
| 32 | 37.25 | 46.89 | 31.72 |
| 32 | 40 | 60.43 | 40.94 |
| 32 | 36.87 | 64.26 | 38.27 |
| 32 | 39.47 | 60.32 | 33.59 |
| 32 | 34.52 | 61.02 | 27.29 |
| 32 | 28.57 | 50.35 | 37.23 |
| 1 | 12.97 | 8.71 | 8.81 |
| 2 | 15.2 | 8.11 | 8.04 |
| 4 | 22.99 | 13.94 | 9.12 |
| 8 | 18.75 | 29.8 | 14.22 |
| 16 | 26.86 | 42.26 | 16.73 |
| 32 | 43.22 | 33.8 | 32.06 |
| 64 | 66.54 | 40.94 | 41.67 |
| 128 | 90.34 | 62.03 | 80.27 |
| 256 | 103.29 | 45.49 | 71 |
| 512 | 79.59 | 70.57 | 70.52 |
| 1023 | |||
| single_nosyncs_90g_node128.2 | single_nosyncs_90g_node129.2 | single_nosyncs_90g_node130.2 | |
| 32 | 26.69 | 46.45 | 47.74 |
| 32 | 29.54 | 51.63 | 24.11 |
| 32 | 29.91 | 56.09 | 37.2 |
| 32 | 23.88 | 66.84 | 39.81 |
| 32 | 39.79 | 45.04 | 43.56 |
| 32 | 41.03 | 33.23 | 50.85 |
| 32 | 46.67 | 44.85 | 43.86 |
| 32 | 46.5 | 45.81 | 40.55 |
| 32 | 45.28 | 37.01 | 38.36 |
| 32 | 38.17 | 50.21 | 39.93 |
| 32 | 27.96 | 50.86 | 39.16 |
| 32 | 42.68 | 52.56 | 37.56 |
| 32 | 35.32 | 67.57 | 29.12 |
| 32 | 31.21 | 45.97 | 37.62 |
| 1 | 12.44 | 17.92 | 8.98 |
| 2 | 11.61 | 22.33 | 25.96 |
| 4 | 16.17 | 36.93 | 20.54 |
| 8 | 12.38 | 41.35 | 32.93 |
| 16 | 28.75 | 53.12 | 42.51 |
| 32 | 16.23 | 42.55 | 52.88 |
| 64 | 22.54 | 31.95 | 43.44 |
| 128 | 35.44 | 69.53 | 84.84 |
| 256 | 28.17 | 65.61 | 37.5 |
| 512 | 50.16 | 59.27 | 43.24 |
| 1023 |
- Log in to post comments
- 14449 views
Some notes.
Hi Henrik, I thought I'd make some observations about this benchmark
The point is that we're trying to close the gap which already is quite limited. All you can go is 0.8 -> 1.0, no more. And so you really need very-very consistent measurements to be able to tell the difference between 4 and 8 slave threads. I don't think this benchmark can show this.
Perhaps a more explicit indicator (rather than raw throughput) would be wsrep_flow_control_paused status variable. It changes all the way 0.0-1.0.
(But ideally you should definitely get independent IO subsystem for each node. It is really hard to estimate to what extent this SAN bottleneck skews the results.)
Hi Alex I agree that the
Hi Alex
I agree that the anomalies in my HW setup make these results mostly useless. My main motivation to publish this is simply to explain the poor results in the earlier disk bound test. I've gotten many worried questions about those, so being able to prove that it is nothing due to Galera or MySQL or InnoDB is important.
Beyond that, the rest of the post could be interesting to someone but has low reliability. For instance it is obvious you can run Galera also with 16 or 32 slave threads without issues, the problems I see here are clearly related to my environment and tuning. I posted the graphs since I had them, and possibly the effects on a single master (blue line) and 1 or 2 slave threads are an interesting discovery, otoh possibly it is something that doesn't happen on a better HW setup.
I'm pretty sure I was not network bound, I really just had bad disk/SAN. For instance, in all the single node tests the client is on local host. I know the problem with the unresponsive nodes was swapping a I can see Linux started to swap. I was also on a mysql console once when it happened and could see MySQL being unresponsive for 30+ secs - this long period very likely is because of swapping.
swapping explains it.
Yes, from our experience, swapping is number 1 cause of cluster partitioning by far. If this is the case, have you remembered to disable NUMA in your servers' BIOS?
Actually, I'm not sure it was
Actually, I'm not sure it was due to NUMA or anything fancy like that. With vm.swappiness at 60 and IO subsystem under stress, I figure it is just "correct" for Linux to swap out MySQL for more filesystem cache.