DRBD and semi-sync benchmarks on a 2x8 132 GB server
I recently had the opportunity to run some benchmarks against a relatively large server, to learn how it was behaving in its specific configuration. I got some interesting results that I'll share here.
We had 2 servers and did benchmarks both against a single node and with DRBD and semi-sync replication. I usualy like to run benchmarks that approximate the application workload, but in this case that wasn't easy to obtain so we just run the standard sysbench oltp tests. The benefit of this is that the results are more comparable to others that also run the same standard tests and can be shared publicly - such as Oracle's Ivan Tu's from 2 days ago. (Btw, beware of the apples to oranges comparison in that benchmark: Red Hat's previous version vs Oracle's most recent version, a classic trick.)
I'd also like to point out that the tests were done merely to get a feeling on the MySQL behavior in different configurations, and they are not as scientific as many of my fellow bloggers often do their benchmarks. A single sysbench run was only 4 minutes, with no pre-warming or anything nor is the data set very big. This made testing fast enough so that we could get it done - and by the way, in the cases where I did repeat some test, they were quite repeatable, so I'm confident in the results. Also I didn't bother running the tests with 1, 2, 4 or 8 clients since I was just interested in what happens at the higher end. Since the server had 16 virtual cpu's, that was a relevant level to start from.
Btw, on that topic, I was very impressed with how especielly MySQL 5.5 keeps up the performance even with 512 client threads. The scalability in this direction simply isn't an issue anymore, and I'll focus on other stuff instead.
The configuration
Before we go to the results...
The server was:
2 sockets, with a total of 8 cores, 16 hyperthreads

132 GB RAM

6x300gb 15k disks, in a RAID 10, on 2 SAS controllers, with battery backed write cache
The interesting parts of the MySQL configuration was:
innodb-buffer-pool-size = 110G

innodb-flush-log-at-trx-commit = 1

sync-binlog = 1

###Semisync

# Master only:

rpl_semi_sync_master_enabled=1

rpl_semi_sync_master_timeout=3000 # 3 seconds

# Slave only:

rpl_semi_sync_slave_enabled=1
I actually didn't use some of the new 5.5 options like innodb-buffer-pool-instances or io-threads stuff, however aftewards I turned them on and they didn't have any effect on test results.
The sysbench command used was:
#!/bin/bash

RUN_TIME=$((60*4))

SYSBENCH=sysbench

#

#OLTPREADONLY="--oltp-read-only"

OLTPREADONLY=

#

echo "Creating sbtest database"

mysql -uroot -pxxxxxx -e "DROP DATABASE If EXISTS sbtest; CREATE DATABASE sbtest;"

$SYSBENCH --test=oltp --mysql-table-engine=innodb --oltp-table-size=10000000 --mysql-user=root --mysql-password=xxxxxx --mysql-socket=/var/run/mysqld/mysqld.sock prepare

#

for THREADS in 1 8 16 64 128 256 512 1024

do

  echo "Restart mysqld to clean caches".

  /etc/init.d/mysql restart

  echo "Sleep 60 seconds to make sure the slave is connected (important only for semi-sync replication tests)."

  sleep 60

  echo "running sysbench for $RUN_TIME seconds with $THREADS threads."

  $SYSBENCH --max-requests=0 --max-time=$RUN_TIME --num-threads=$THREADS --test=oltp --oltp-table-size=10000000 --mysql-user=root --mysql-password=xxxxxx --mysql-socket=/var/run/mysqld/mysqld.sock $OLTPREADONLY run

done
A sysbench table of 10 million rows is large enough to be non-trivial, but small enough to be fast to create. It fits into memory, of course.
Read-only and Read-write tests, and also with DRBD
So, to get some baseline results I first ran the oltp tests both in read-only and read-write modes. Below you will see first the nr of read/write requests per second, and second the minimum, average and 95% latencies with different configurations.
Note that I use the read/write requests per second instead of transactions per second results. The transactions sysbench does here contain multiple statements of different kinds. The number of reads or writes per second is something I can easily relate to, but not knowing what goes on inside the transaction, that number had no meaning to me.
Btw, in the read only workload of course 100% of the operations are reads, and in the read/write workload about 25% are writes, 75% reads.
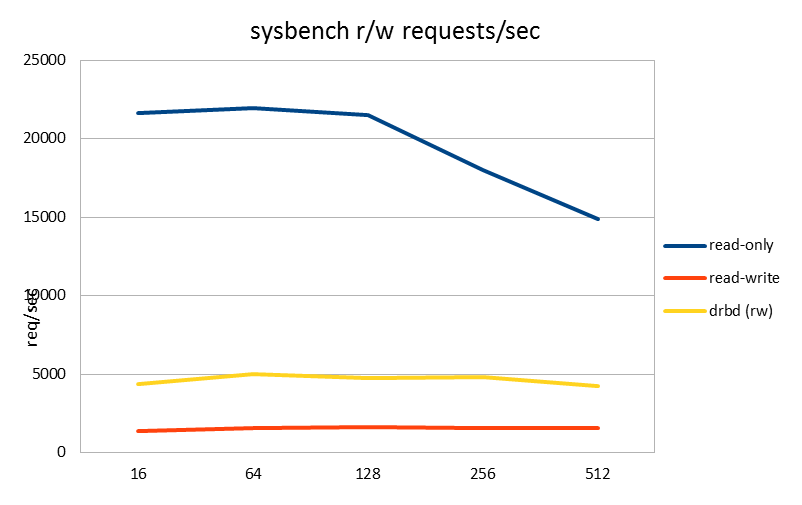
| requests/sec | 16 | 64 | 128 | 256 | 512 |
|---|---|---|---|---|---|
| read-only | 21594.87 | 21958.1 | 21523.31 | 18025.68 | 14843.1 |
| read-write | 1373.22 | 1574.03 | 1639.68 | 1573.17 | 1535.2 |
| drbd (rw) | 4373.21 | 4988.45 | 4737.18 | 4824.21 | 4226.01 |
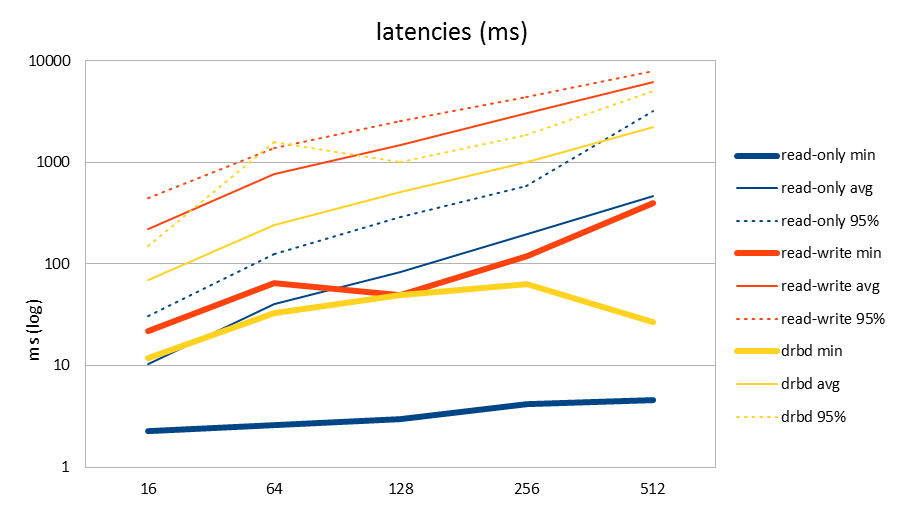
| latency (ms) | 16 | 64 | 128 | 256 | 512 |
| read-only min | 2.25 | 2.59 | 2.96 | 4.21 | 4.52 |
| read-only avg | 10.35 | 40.72 | 82.8 | 197.65 | 468.77 |
| read-only 95% | 30.87 | 125.14 | 290.02 | 581.86 | 3183.94 |
| read-write min | 22 | 64.37 | 49.69 | 118.66 | 398.51 |
| read-write avg | 221.26 | 770.39 | 1474.64 | 3058.74 | 6192.28 |
| read-write 95% | 447.92 | 1389.09 | 2543.69 | 4448.12 | 7943.08 |
| drbd min | 11.74 | 33.03 | 49.46 | 63.92 | 26.86 |
| drbd avg | 69.47 | 243.24 | 511 | 1000.3 | 2250.76 |
| drbd 95% | 150.57 | 1576.52 | 1006.58 | 1841.04 | 4997.43 |
The read only workload was run first. I usually benchmark workloads that mimic some specific application and wasn't that familiar with these out of the box sysbench tests, so I didn't have much context to compare these numbers to. Knowing that many of the operations are more complex than just a single row select, doing more than 20k per second sounds like a good number. There is quite a big spread between the minimum variance and 95% variance, but remember that also the queries are different: some are simple, some quite complex.
Then again, something is suspicious with the read-write test. Numbers drop to less than 10% of the read-only test! And remember that 75% of those transactions are still reads, you would expect at least that fraction to perform better. Also the latencies, including minimum latencies, have grown 10x and more (which correlates well with throughput being 10x lower).
Not having a simple answer for this, I then continued to setup DRBD replication on the server. With synchronous DRBD replication turned on, you see that the read-write test actually performs better than without. This is confusing! The effect of DRBD is to add a quite significant latency to disk writes, so you'd expect to take a performance hit. But here we have 3-4x more tps, and less than half the latencies.
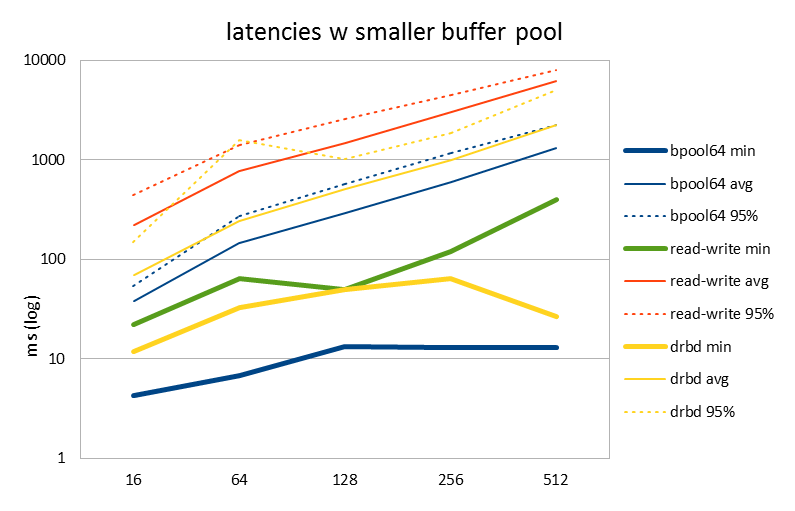
InnoDB contention with 100+GB buffer pool
All of this was very confusing to a poor performance architect. Luckily for me, at this point in time the MySQL conference interrupted me. I was listening to Vadim's benchmarks using SSD's and was awake to notice when he pointed out that with the InnoDB buffer pool set to more than 100GB, InnoDB performance became really poor whereas with a smaller buffer pool you'd have great performance. This was like a side remark and unrelated to the topic of SSD's and Vadim just brushed it off with "at this point we hit new InnoDB contention issues again". Ok, but that could be what I was experiencing too...
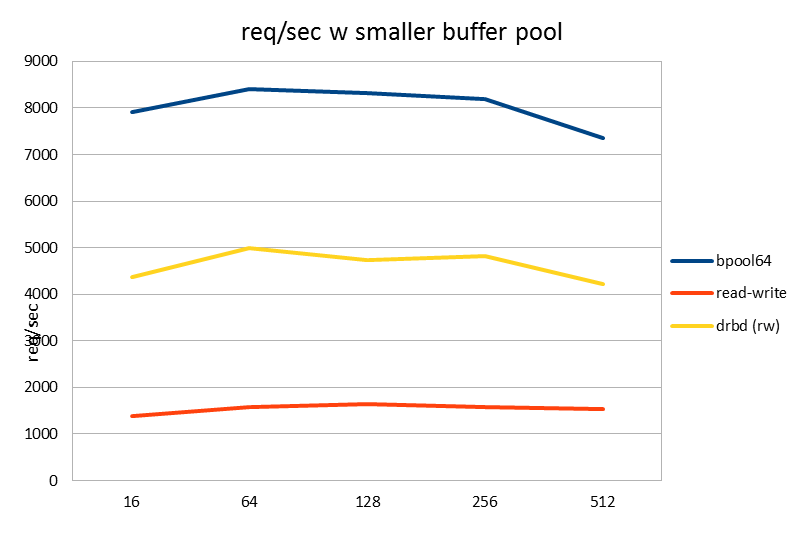
| requests/sec | 16 | 64 | 128 | 256 | 512 |
| bpool64 | 7918.81 | 8402.72 | 8309.01 | 8193.7 | 7352.08 |
| read-write | 1373.22 | 1574.03 | 1639.68 | 1573.17 | 1535.2 |
| drbd (rw) | 4373.21 | 4988.45 | 4737.18 | 4824.21 | 4226.01 |
| latency (ms) | 16 | 64 | 128 | 256 | 512 |
| bpool64 min | 4.3 | 6.74 | 13.41 | 13.07 | 12.99 |
| bpool64 avg | 38.36 | 144.67 | 292.54 | 592.96 | 1320 |
| bpool64 95% | 54.19 | 269.84 | 569.79 | 1175.77 | 2240.49 |
| read-write min | 22 | 64.37 | 49.69 | 118.66 | 398.51 |
| read-write avg | 221.26 | 770.39 | 1474.64 | 3058.74 | 6192.28 |
| read-write 95% | 447.92 | 1389.09 | 2543.69 | 4448.12 | 7943.08 |
| drbd min | 11.74 | 33.03 | 49.46 | 63.92 | 26.86 |
| drbd avg | 69.47 | 243.24 | 511 | 1000.3 | 2250.76 |
| drbd 95% | 150.57 | 1576.52 | 1006.58 | 1841.04 | 4997.43 |
So I went back to the experiment and set the buffer pool to 64GB. Sure enough, good performance both in req/sec and latencies was achieved!
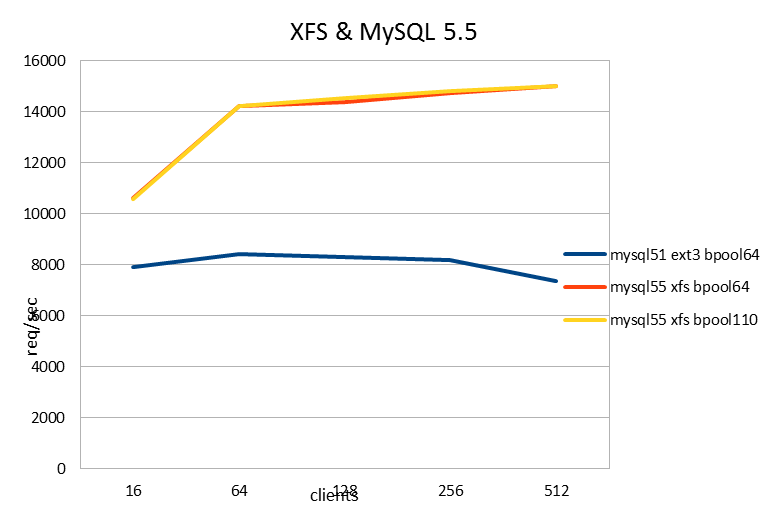
Using MySQL 5.5 and XFS
At the user conference I also learned from Yoshinori's tutorial why everyone uses XFS instead of ext3: because XFS allows mysql to write to the same file with multiple threads concurrently, which obviously is a big deal for large database tables. In the previous tests, ext3 had been used just since it is the default.
| requests/sec | 16 | 64 | 128 | 256 | 512 |
| mysql51 ext3 bpool64 | 7918.81 | 8402.72 | 8309.01 | 8193.7 | 7352.08 |
| mysql55 xfs bpool64 | 10610.73 | 14221.56 | 14365.29 | 14724.68 | 14997.44 |
| mysql55 xfs bpool110 | 10580.58 | 14235.42 | 14536.82 | 14818.83 | 14990.36 |
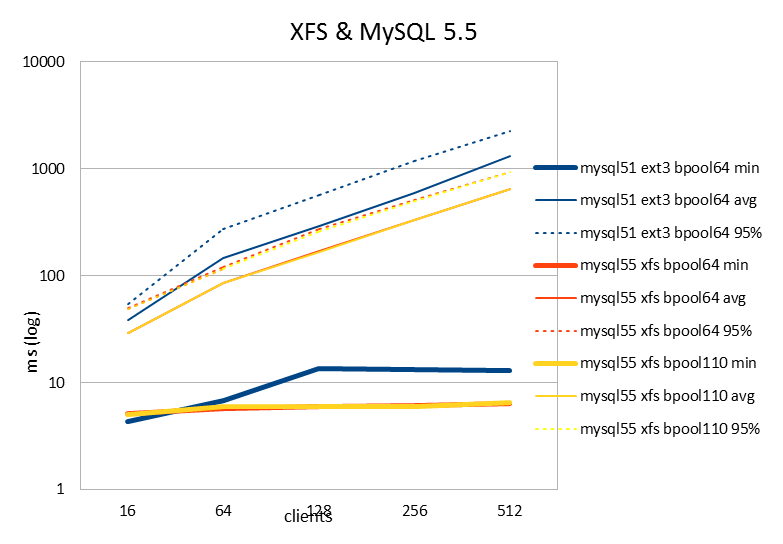
| latency (ms) | 16 | 64 | 128 | 256 | 512 |
| mysql51 ext3 bpool64 min | 4.3 | 6.74 | 13.41 | 13.07 | 12.99 |
| mysql51 ext3 bpool64 avg | 38.36 | 144.67 | 292.54 | 592.96 | 1320 |
| mysql51 ext3 bpool64 95% | 54.19 | 269.84 | 569.79 | 1175.77 | 2240.49 |
| mysql55 xfs bpool64 min | 5.11 | 5.73 | 5.96 | 6.12 | 6.29 |
| mysql55 xfs bpool64 avg | 28.64 | 85.47 | 169.22 | 330.04 | 647.68 |
| mysql55 xfs bpool64 95% | 49.77 | 119.97 | 274.48 | 513.73 | 930.94 |
| mysql55 xfs bpool110 min | 4.98 | 5.99 | 5.95 | 5.95 | 6.4 |
| mysql55 xfs bpool110 avg | 28.72 | 85.39 | 167.23 | 327.94 | 647.92 |
| mysql55 xfs bpool110 95% | 49.08 | 116.71 | 263.85 | 502.03 | 930.66 |
Compared to MySQL 5.1 and ext3, this resulted in an 80% performance increase! We know that MySQL 5.5 improves over MySQL 5.1, but not that much. Most of the improvement clearly must be from using XFS as the file system. (Sorry for leaving this untested, knowing the answer to this questions just isn't important to me at this point.)
With this setup in place, I also wanted to find out how large the buffer pool can be before experiencing InnoDB contention. To my surprise, with XFS there weren't any problems, but MySQL performed well also with a 110GB buffer pool! You can see that the yellow and red lines are exactly similar. Since the data set is much smaller than 64GB, this is how it should behave.
Why might this happen? 1) XFS allows multiple threads to write to the data files simultaneously, so this probably reduces contention. 2) But another clue might be this: on 16 clients or less, the XFS latency is slightly higher than for ext3 (which you can barely see from the graphs here, but is more clear on 1-8 client threads.) Also for the DRBD workload tested above, the latency of disk writes of course is higher than without DRBD.
I believe latency is what affects whether the anomalous InnoDB condition triggers or not - in fact I want to believe that, since it is the only rational explanation to why turning on DRBD can yield better performance than a single node system has. It is common that a poorly performing contended system might paradoxically perform better if the throughput is throttled somewhere. In this case slower disk writes prevent the InnoDB anomaly from triggering.
Note that Vadim's benchmarks were done on SSD's, so he had much smaller latencies, even if using XFS.
What I don't know yet is if it is safe to run with 110GB buffer pool now? Maybe under some other workload the anomaly can still be triggered even if I'm using XFS now. In that case we just go back down to a smaller buffer pool until the problem is solved.
Semi synchronous replication
I then also wanted to test semi-sync replication. In fact, I found that using an InnoDB log-file of 2x1.5GB, the recovery times could still be more than 5 minutes. (Test used was to insert several gigabytes from a mysqldump file, then failover to other DRBD node.) When using DRBD, this also becomes part of your failover time. For an online service it seemed a bit much, so we were interested in a better alternative.
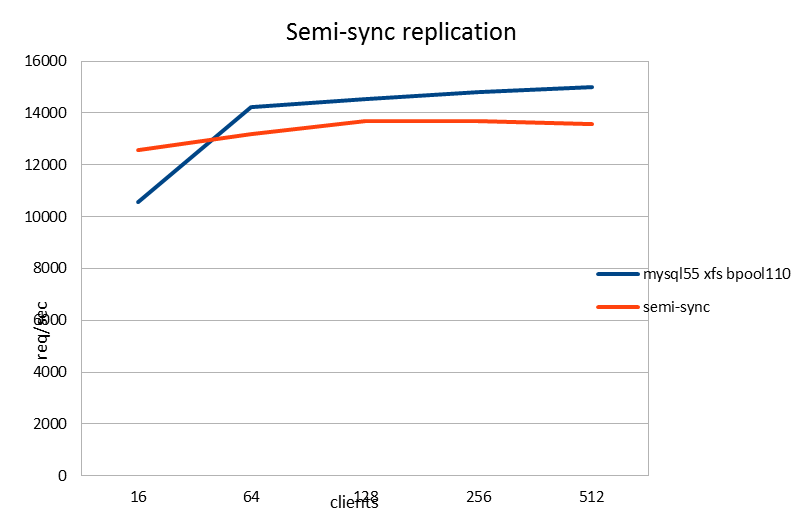
| requests/sec | 16 | 64 | 128 | 256 | 512 |
| mysql55 xfs bpool110 | 10580.58 | 14235.42 | 14536.82 | 14818.83 | 14990.36 |
| semi-sync | 12573.71 | 13187.09 | 13670.54 | 13670.37 | 13589.85 |
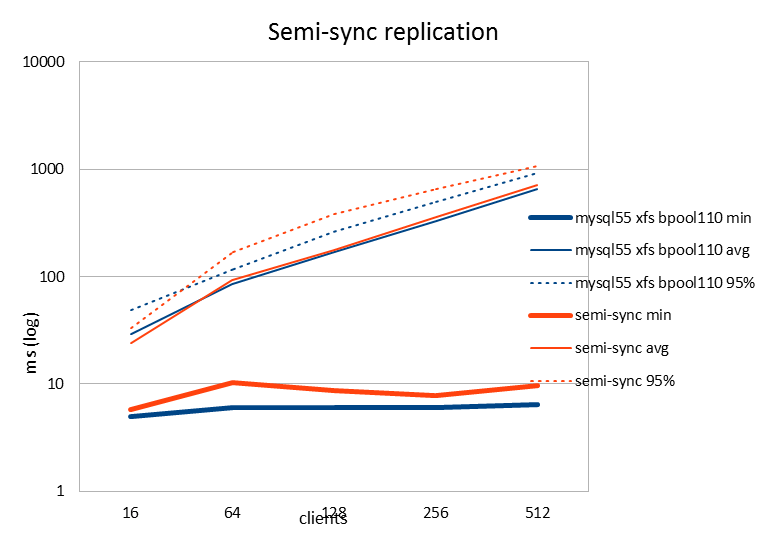
| latency (ms) | 16 | 64 | 128 | 256 | 512 |
| mysql55 xfs bpool110 min | 4.98 | 5.99 | 5.95 | 5.95 | 6.4 |
| mysql55 xfs bpool110 avg | 28.72 | 85.39 | 167.23 | 327.94 | 647.92 |
| mysql55 xfs bpool110 95% | 49.08 | 116.71 | 263.85 | 502.03 | 930.66 |
| semi-sync min | 5.73 | 10.19 | 8.6 | 7.7 | 9.52 |
| semi-sync avg | 24.17 | 92.19 | 177.85 | 355.63 | 715.17 |
| semi-sync 95% | 33.2 | 168.2 | 378.45 | 649.23 | 1068.05 |
The semi-sync results were also surprising. The performance is pretty much the same compared to single node performance without replication. Again, since we are adding overhead to the commit phase (the "synchronous" part in semi-syncrhonous replication) I was expecting to see a drop in performance. At first I really thought I'm doing something wrong, but doing SHOW STATUS LIKE "%semi%"; both on the master and slave seems to indicate it really was semi-synchronous replication happening.
I need to speak to people who really know how the semi-sync replication works, but I'm speculating that either of the following is the explanation:
1) Since I'm using sync_binlog=1, the flushing of the binlog on the master side is already constraining our maximum performance and the semi-sync replication can complete its work faster than this constraint. There is the saying "writing to a remote RAM is faster than writing to a local disk". I'm putting my money on this explanation.
2) It could also be that the semi-sync implementation allows the commit to return when the receipt from the slave returns, before the master binlog has completed flushing. This could have been done by accident (new code path in semi-sync code) or on purpose (since we have already copied the transaction to remote purpose, flushing the master binlog isn't important anymore). Since we have sync_binlog=1 I would call this alternative a bug.
The return of group commit: sync_binlog=0
Speaking of sync_binlog, I should be able to set it off now, shouldn't I? Semi-sync replication guarantees that the transaction is already copied to the slave, so meticulously syncing the binary log on the master seems less important. Galera guys do it too, in fact they even turn off InnoDB flushing too.
Remember that it is a long time bug that setting both sync_binlog=1 and innodb_flush_log_at_trx_commit=1 will disable InnoDB group commit, which gives a severe hit in performance. So with setting sync_binlog=0 I am not just avoiding one fsync, I'm expecting fundamental improvements:
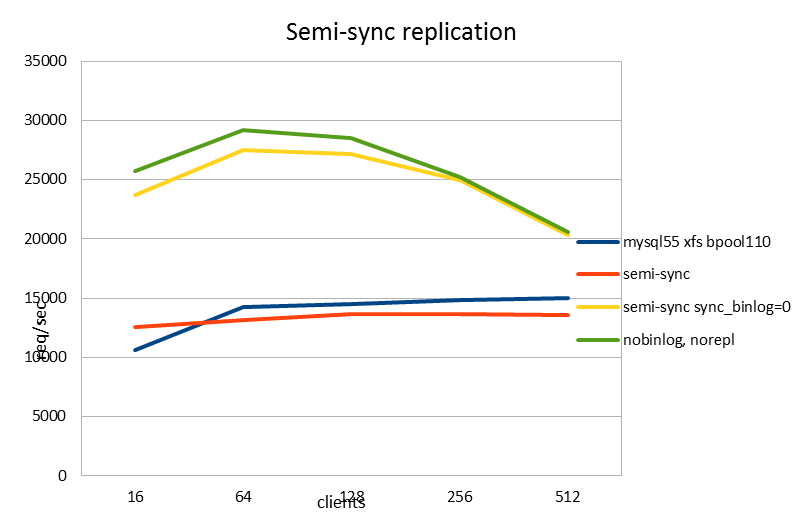
| requests/sec | 16 | 64 | 128 | 256 | 512 |
| mysql55 xfs bpool110 | 10580.58 | 14235.42 | 14536.82 | 14818.83 | 14990.36 |
| semi-sync | 12573.71 | 13187.09 | 13670.54 | 13670.37 | 13589.85 |
| semi-sync sync_binlog=0 | 23735.92 | 27532.15 | 27186.83 | 24936.92 | 20302.11 |
| nobinlog, norepl | 25684.13 | 29220.39 | 28514.72 | 25194.63 | 20562.35 |
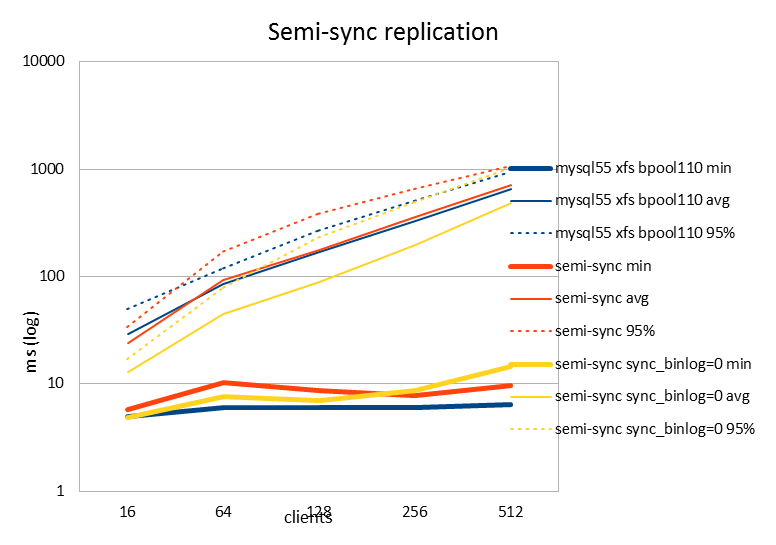
| latency (ms) | 16 | 64 | 128 | 256 | 512 |
| mysql55 xfs bpool110 min | 4.98 | 5.99 | 5.95 | 5.95 | 6.4 |
| mysql55 xfs bpool110 avg | 28.72 | 85.39 | 167.23 | 327.94 | 647.92 |
| mysql55 xfs bpool110 95% | 49.08 | 116.71 | 263.85 | 502.03 | 930.66 |
| semi-sync min | 5.73 | 10.19 | 8.6 | 7.7 | 9.52 |
| semi-sync avg | 24.17 | 92.19 | 177.85 | 355.63 | 715.17 |
| semi-sync 95% | 33.2 | 168.2 | 378.45 | 649.23 | 1068.05 |
| semi-sync sync_binlog=0 min | 4.87 | 7.66 | 6.91 | 8.63 | 14.59 |
| semi-sync sync_binlog=0 avg | 12.8 | 44.15 | 89.43 | 194.98 | 478.89 |
| semi-sync sync_binlog=0 95% | 17.02 | 78.5 | 232.12 | 487.51 | 1009 |
| nobinlog, norepl min | 4.15 | 5.07 | 5.19 | 7.19 | 7.23 |
| nobinlog, norepl avg | 11.82 | 41.6 | 85.26 | 193 | 472.8 |
| nobinlog, norepl 95% | 15.12 | 77.89 | 196.41 | 528.71 | 1039.35 |
And behold, performance was improved by more than 2x!
Note that this improves also over the single node situation, so semi-sync replication is now a performance gain rather than drag. Of course, this is only the case until we get a fix to the group commit bug.
For good measure I also did a run with a single node with the binary log turned off completely. This is shown in green. It was 6-8% better (req/sec) than the run with sync_binlog=0 and semi-sync replication on. So that means the overhead of semi-sync replication is really small and performance is close to the "ideal" case. I really like these results.
You'll also note that the req/sec for both of these runs is better than for the original read-only test. That's yet another result that doesn't quite make sense. It could be just a sysbench thing: Possibly the INSERT and UPDATE operations are simpler in nature than the 25% of SELECT operations they have replaced. For instance, you don't do JOINs on write operations. UPDATE: I now realize the read-only test was on MySQL 5.1 and this one is 5.5, so perfectly possible performance is simply better here.
So using semi-sync replication with sync_binlog=0 looks like a very good thing to do. I'll need to check with people who know what the semi-sync replication does exactly, to verify that this is safe to do.
- Log in to post comments
- 14270 views