So, vacation is over and I was in luck: Already during first week I had ample time to finally put Galera replication to the test. It was a great experience: I learned a lot, and eventually got the great results I was hoping to see.
Again I've started by just running the standard Sysbench oltp read-write test. Since this is a commonly used benchmark, it produces numbers that are comparable with others running the same benchmarks. Including, as it happens, Galera developers themselves.
These tests were run on an 8 core server with 32 GB of RAM and the disk on some EMC device with a 2,5GB write cache.
I was using the Galera demo distribution provided by Codership guys. It's a recent MySQL 5.1, where I also enabl the InnoDB plugin. I then changed the following configuration parameters:
# Variables

# Caveat: A couple of these occur again later in this file, must comment out for these to have effect.

innodb_flush_log_at_trx_commit=0

innodb_doublewrite=0

sync_binlog=0

# Constant

innodb_buffer_pool_size=15000M

innodb_log_file_size=1500M

innodb_log_files_in_group=2

innodb_locks_unsafe_for_binlog=1

wsrep_slave_threads=32
As you can see, Galera allows me to use multiple parallel threads on the slave side, to combat slave lag. And it's a very general solution too: Any work on applying transactions can be somewhat parallelized, even if the commit order is still preserved. You can also choose to allow slave to commit out of order, but in this test that would not have helped anything. I took that option into use as I was troubleshooting some poor performance, but in the end the problem was not on Galera side at all. So in a normal situation most of those threads just show up as idle in SHOW PROCESSLIST. However, it's a nice feeling to know that replication is not a bottleneck anymore.
The sysbench command used was
#!/bin/sh


# Run this manually to prepare some tables:

# sysbench --test=sysbench/tests/db/oltp.lua --mysql-host=host1 \

#    --mysql-user=root --mysql-password=rootpass --mysql-table-engine=InnoDB \

#    --mysql-engine-trx=yes --oltp-table-size=2000000 --max-time=300 \

#    --max-requests=0 --num-threads=1 --oltp-tables-count=10 \

#    --oltp-auto-inc=off prepare \

# The above creates a dataset roughly

# 189,8*2000000*10/1024/1024 = 3620M = 3,5G


#NUM_THREADS="1"

NUM_THREADS="1 2 4 8 16 32 64 128 256 512 1023"


for N in $NUM_THREADS

#while test 1

do

# --oltp-auto-inc=off is undocumented, but important when running galera.

# sysbench assumes that autoinc columns will be a continuos sequence 1,2,3...

# but with galera they're not (auto_increment_increment)

  sysbench/sysbench --test=sysbench/tests/db/oltp.lua \

    --mysql-host=host1,host2,host3 \

    --mysql-user=root --mysql-password=rootpass \

    --mysql-table-engine=InnoDB --mysql-engine-trx=yes \

    --oltp-table-size=2000000 --max-time=60 \

    --max-requests=0 --num-threads=$N --oltp-tables-count=10 \

    --oltp-auto-inc=off run

#  sleep 5

done
I'm using the development version of sysbench 0.5, which allows me to spread the test over more than one table. In the end there's no difference from just doing the test agains one large table instead, since I'm still using a single tablespace. With 10x2M rows, the dataset fits well in memory on this server.
In the graphs below I'm using transactions/second. One transaction consists of 14 selects, 2 updates, 1 delete and 1 insert. If you wanted to measure queries per second, you would multiply these numbers by 18.
Benchmarking single node behavior
Ok, here we go. To get a baseline which to compare against, I first started a single mysql node and ran the benchmark against that. I first set sync_binlog and innodb_trx_flush_at_trx_commit and innodb_doublewrite all to 1 (blue). This is the setting you'd run on a normal mysql server to guarantee data durability. (It's also the default, in case you wonder.)
As is famously known, InnoDB supports group commit, which is an important performance optimization, but enabling the binary log and setting sync_binlog=1 breaks this functionality so that InnoDB and the binary log will both fsync to disk after each single transaction. For this reason, many people run in prodution with sync_binlog=0, to make group commit work and instead sacrifice some reliability on the replication side. Since this is a commonly used setting, I also benchmarked that (red).1
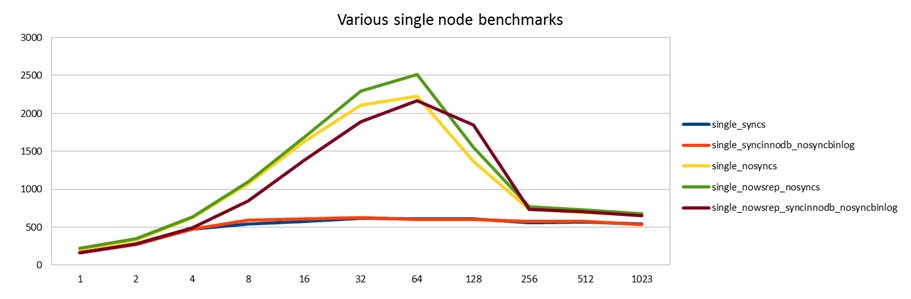
This is a surprising result. The red and blue lines are essentially the same, even if the red one should show better performance.
iostat 1 reports my disk is doing roughly 2000 io per second, and since I know MySQL has to do 3 fsyncs per transaction, then 600 transactions/second sounds about right. This is expected for the blue line, but I was expecting more from the red.
After a while of thinking I realize this MySQL binary now also has another replication engine, galera, included. Even if it's not replicating anywhere yet, maybe it has similar effects in breaking InnoDB group commit. So I try the last test again with galera disabled (brown):
wsrep_provider=none
(In fact, in the demo package this is set by the custom startup script on the command line, and you have to comment out that row in the shell script. The my.cnf setting does nothing.)
That improves performance to something like I was expecting it to be. With group commit working and using a write back cache on the disk controller, this should be close to the max performance I expect to get.
Finally I also run a test with both sync_binlog and innodb_... variables set to 0 (yellow with galera module loaded, green with galera unloaded). This is not something you'd normally do on your MySQL server. But it is a safe optimization when using synchronous replication like Galera. The idea is that transactions are made durable by being copied to the other node(s) rather than written to disk (which they now are not immediately after commit) and they will thus survive the crash of one node. They wouldn't survive simultaneous crash of all nodes, just like commits to disk won't survive a fire that melts down your disks - both of these tend to be quite rare events MySQL Cluster follows the same principle. The tag line for this kind of thinking is: "Writing to remote RAM is faster than local disk."
Both of those tests also show good results. It's no surprise that the setting with galera unloaded and no syncs anywhere is slightly better than anything else. On the other hand, the brown line with InnoDB group commit is essentially just as good. This is thanks to the write cache. If I had just a normal disk, the difference would be bigger.
First try with Galera cluster
Having set a baseline we can compare against, it's now time to fire up a 3 node Galera cluster. Galera automatically provisions the new nodes with the data from the node that is already running. This is very convenient, I don't have to copy backups around manually, or re-run the sysbench prepare stage. Currently this is done by mysqldump, but Vadim already has a bzr repository where xtrabackup is included as a donor method.
In the following graph, I kept the graphs with sync_binlog=1 (blue) and =0 (red) from the previous graph.
I then do tests where I
- write against 1 master node only, and 2 nodes remain as purely passive slaves. (yellow)
- write against 2 masters, with 1 node remaining as a slave (green)
- write against all 3 masters concurrently (brown)
Note that the concept of master and slave are here purely an application side decision. There's no change in the configuration of the Galera cluster, it's just a matter of deciding which node to connect to.
In fact, sysbench makes this very easy as it allows me to give a list of nodes separated by commas, such as --mysql-host=host1,host2,host3. This is in the same spirit I outlined in my recent post The Ultimate MySQL High-Availability Solution.
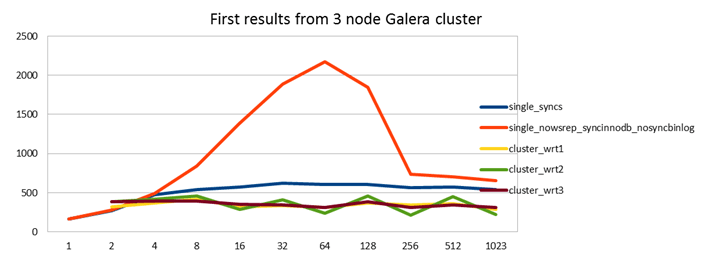
The results of my first run were very poor, the Galera cluster basically didn't scale beyond 2 client threads and writing to several nodes didn't help the situation.
I got a lot of help from Alex and Seppo on the codership mailing list in troubleshooting this situation, and learned how to read Galera related status values in the process.
The problem is seen in a SHOW PROCESSLIST taken from the slave side:
host2 >show processlist;

+------+-------------+-----------------+------+---------+------+-----------------------------------------------+------------------+

| Id   | User        | Host            | db   | Command | Time | State                                         | Info             |

+------+-------------+-----------------+------+---------+------+-----------------------------------------------+------------------+

|    1 | system user |                 | NULL | Sleep   |    2 | post RBR applying (5610209)                   | NULL             |

|    2 | system user |                 | NULL | Sleep   |    2 | post RBR applying (5610197)                   | NULL             |

|    3 | system user |                 | NULL | Sleep   |    2 | post RBR applying (5610224)                   | NULL             |

|    4 | system user |                 | NULL | Sleep   | 6058 | wsrep aborter idle                            | NULL             |

|    5 | system user |                 | NULL | Sleep   |    2 | post RBR applying (5610203)                   | NULL             |

|    6 | system user |                 | NULL | Sleep   |    2 | post RBR applying (5610200)                   | NULL             |

|    7 | system user |                 | NULL | Sleep   |    2 | post RBR applying (5610226)                   | NULL             |

|    8 | system user |                 | NULL | Sleep   |    2 | post RBR applying (5610206)                   | NULL             |

|    9 | system user |                 | NULL | Sleep   |    2 | post RBR applying (5610213)                   | NULL             |

|   10 | system user |                 | NULL | Sleep   |    2 | post RBR applying (5610215)                   | NULL             |

|   11 | system user |                 | NULL | Sleep   |    2 | Delete_rows_log_event::ha_delete_row(5610196) | NULL             |

|   12 | system user |                 | NULL | Sleep   |    2 | post RBR applying (5610204)                   | NULL             |

|   13 | system user |                 | NULL | Sleep   |    2 | post RBR applying (5610220)                   | NULL             |

|   14 | system user |                 | NULL | Sleep   |    2 | post RBR applying (5610217)                   | NULL             |

|   15 | system user |                 | NULL | Sleep   |    2 | post RBR applying (5610210)                   | NULL             |

|   16 | system user |                 | NULL | Sleep   |    2 | post RBR applying (5610198)                   | NULL             |

|   17 | system user |                 | NULL | Sleep   |    2 | post RBR applying (5610207)                   | NULL             |

|   18 | system user |                 | NULL | Sleep   |    2 | post RBR applying (5610227)                   | NULL             |

|   19 | system user |                 | NULL | Sleep   |    2 | post RBR applying (5610222)                   | NULL             |

|   20 | system user |                 | NULL | Sleep   |    2 | post RBR applying (5610211)                   | NULL             |

|   21 | system user |                 | NULL | Sleep   |    2 | post RBR applying (5610223)                   | NULL             |

|   22 | system user |                 | NULL | Sleep   |    2 | post RBR applying (5610208)                   | NULL             |

|   23 | system user |                 | NULL | Sleep   |    2 | post RBR applying (5610212)                   | NULL             |

|   24 | system user |                 | NULL | Sleep   |    2 | post RBR applying (5610202)                   | NULL             |

|   25 | system user |                 | NULL | Sleep   |    2 | post RBR applying (5610201)                   | NULL             |

|   26 | system user |                 | NULL | Sleep   |    2 | post RBR applying (5610221)                   | NULL             |

|   27 | system user |                 | NULL | Sleep   |    2 | post RBR applying (5610216)                   | NULL             |

|   28 | system user |                 | NULL | Sleep   |    2 | post RBR applying (5610205)                   | NULL             |

|   29 | system user |                 | NULL | Sleep   |    2 | post RBR applying (5610199)                   | NULL             |

|   30 | system user |                 | NULL | Sleep   |    2 | post RBR applying (5610219)                   | NULL             |

|   31 | system user |                 | NULL | Sleep   |    2 | post RBR applying (5610214)                   | NULL             |

|   33 | system user |                 | NULL | Sleep   |    2 | post RBR applying (5610225)                   | NULL             |

|   34 | system user |                 | NULL | Sleep   |    2 | post RBR applying (5610218)                   | NULL             |

| 1187 | root        | localhost:59314 | NULL | Query   |    0 | sleeping                                      | show processlist |

+------+-------------+-----------------+------+---------+------+-----------------------------------------------+------------------+

34 rows in set (0.00 sec)
The following wsrep status values are interesting to monitor:
| wsrep_local_send_queue     | 0                                    |

| wsrep_local_send_queue_avg | 0.000000                             |

| wsrep_local_recv_queue     | 0                                    |

| wsrep_local_recv_queue_avg | 0.262727                             |

| wsrep_flow_control_paused  | 0.609370                             |
What is seen happening above is that 1 of the wsrep_slave threads is trying to delete a row in InnoDB (it could also be insert or update) and all the other ones are waiting for their turn. The numbers you see are the sequence part of the global transaction id (I think) and you can see that the event that is stuck has the lowest number, and all others must wait for it to complete before they can continue to commit.
The wsrep_flow_control_paused variable shows the fraction of time replication was paused due to threads waiting for their turn - as in the above processlist. It is usually zero or very small. Now it was more than 0.5, even 0.9.
From this Alex was able to conclude that the problem really is on InnoDB side, it's InnoDB everyone is waiting for here. Since I didn't have any problems on single node workload, I first didn't believe him, but as it happens, increasing innodb_log_file_size from 100M to 2x1.5G made the problem go away! I know keeping it at 100M is kind of small, but like I said, it didn't cause any problems in the single node run. Why InnoDB behaves differently when exactly the same transactions are applied from a slave thread instead of a sysbench client connection is currently an unknown, but it does. Perhaps it gets confused by the fact that a slave workload is write-only, whereas on the master you also have selects.
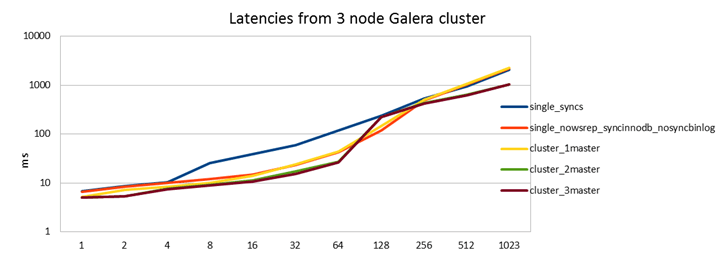
Time to re-run the tests. Again the red and blue curves are copied from the previous graph to give a baseline to compare against. I will also include latencies now.
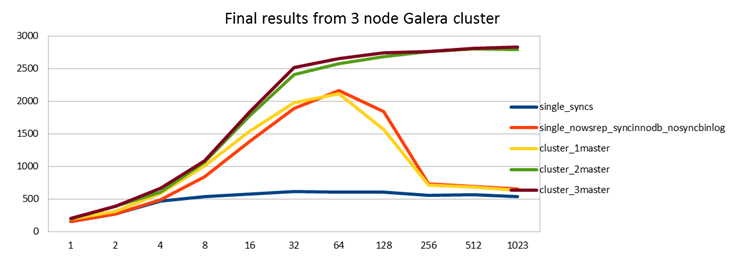
Good results!
What we see here is that first of all, even just writing to 1 Galera master you get similar performance as a standalone server with innodb_flush_log_at_trx_commit=1. So there is no overhead at all from the replication, but you now have a true highly available synchronously replicated cluster. This is even confirmed with the latency graph, there simply isn't any penalty from the synchronous replication here.
Of course, if I didn't have battery backed up write cache on my servers, then Galera would be a huge win here! This is again similar to MySQL Cluster architecture: better software architecture provides great performance with lesser hardware.
Analysis
These results are already great in the sense that I get equal or better performance by deploying a Galera cluster compared to standalone MySQL node. But I can already see this is not the maximum I could get out of this cluster. For one thing I don't see almost any benefit from connecting to all 3 nodes compared to 2 nodes. Also when looking at top during the benchmark, in the single node test I can see MySQL consuming more than 700% CPU (where 800% is theorethical maximum for a 8 core server), but in the tests with a Galera cluster each node only reaches about 600%. In other words, something is keeping it down.
A nice property of Galera's behavior here is also that even if it maxes out at some point, the graphs don't go back down as they often do in single node MySQL benchmarks, but performance stays flat even when you increase the amount of client threads. Again, I don't know exactly why this is, but it's very nice.
I did try to peek under the hood to get an idea of what is limiting me. For instance I suspected I could already be limited by network interrupts on the client side. To test this I ran 512+512 and 1023+1023 sysbench clients from two different machines, however I didn't get better results.
From looking at show processlist, show status like "%wsrep%" and top, I see similar behavior as I did originally in the tests with poor results. I therefore suspect I have again reached a limit where purging the InnoDB log file is blocking everything else. Also iostat shows a pattern of io activity going up and down in waves.
Since I didn't want this to turn into an excercise in InnoDB tuning, I didn't go further, but I am convinced that I can get even better numbers if I needed to.
Next up, same test with larger tables to see how a disk-bound workload behaves.
- 1FYI, the bug where group commit breaks has been fixed in MariaDB 5.3.0 beta, will be fixed in Percona Server (or is already? need to check...), and Oracle is previewing a different fix in MySQL 5.6 preview releases.
- Log in to post comments
- 49342 views
Can you also show the results
Can you also show the results for a single node with no binlog at all? That would be a good baseline for measuring the overhead of Galera.
Unfortunately I didn't do
Unfortunately I didn't do such tests. On all real life MySQL servers I ever work with the binlog is usually on. Even if not for replication then to enable point in time recovery. So I considered that a more useful baseline. The sync_binlog=0 tests should be a good lower bound approximation for that though.
Note that galera takes ROW based replication events as its own input, so you actually have the binlog on when running galera.
One thing that admittedly is unclear in the above analysis though: Even if the binlog is producing the ROW events, it seems it didn't actually write them to any file (binlog is ON, but the file path is empty). That is a weird setting and I'm actually not quite clear what MySQL internally does in such a situation... Seems like the binlog does its work but then just throws away the contents? The first part of my analysis with 600 vs 2000 iops may be flawed in this case.
Alex speaks:
Hi Henrik,
Thanks for giving it a spin on a decent hardware. Here's some thoughts about your findings:
1) About mysqldump state transfer. While we are waiting for Percona's xtrabackup, everybody could try rsync SST method. mysqldump is a default setting for being "classic", but rsync is much faster on large data sets (I'd suspect it would be even faster than xtrabackup, but it is blocking, like mysqldump). I'd advise to use rsync SST if you go for a multi-gigabyte datasets.
2) The reason master didn't suffer from small log file size is rather simple, but maybe not so simple to explain. Suppose on master one client connection got stuck in one query on fetching/flushing a page. How would it affect other connections? In no way - they'd keep on committing as usual, because there is no predefined order for local commits. The connection has all time in the world to process and apply the transaction. Only when it is fully done (in commit phase) does it go to replication and gets its commit ordered. On slave however:
- slave has to apply instantaneously the event that master could have spent hours on.
- commit order is predefined, slow replication events can't be reordered.
3) Lack of scalability usually means that there is saturation somewhere in communication and servers are simply underloaded (and that's why the curves don't go down with more connections). Having wsrep_% status here would help a lot in diagnosing the cause. But I'll make some guesses.
- The fact that in multi-master tests the latency jumps an order of magnitude when going from 64 to 128 clients is very strange and might mean some issues in the client network. After all we're talking about ~2800*(18+2)*2 = ~112000 packets a second (if not more). If you have a 1Gb client network, it is very likely to be a limiting factor here.
- Galera TCP transport could also be a bottleneck (although synthetic tests have shown it to be capable of a much-much higher throughputs) so it might make sense to try UDP multicast transport (http://www.codership.com/wiki/doku.php?id=galera_parameters_0.8)
- however I would not rule out your suspicion that it is all InnoDB doing, especially if you say that symptoms are similar. Actually, 128 clients in 2-node cluster are equivalent to 64 clients on standalone node - and that's where we see single server performance starts to degrade. I wonder if this is an InnoDB property and can be reproduced on a stock MySQL? Furthermore, in multi-master setup each node is a slave to others now, and so it will suffer slave penalties outlined above.
BTW, do you have separate client and replication networks? How are they rated?
Regards,
Alex
Thanks again for your
Thanks again for your comments.
1) Thanks for reminding me. I obviously need to switch to rsync for the next test with more data.
2) Could be. The thing is that with sysbench I still only have a set number of client connections, so if InnoDB blocks all of them at purge phase, they will be equally blocked. But there's still opportunity for them to do more than there is for the slave threads. It is a different dynamic for sure. The other thing to consider is: multi-master replication distributes the read-load, but per-node write load is the same. Ie with writing to 2 masters with 64 threads, I have the equivalent of 32 sysbench threads reading, but equivalent of 64 sysbench threads writing. So it is more write heavy than the single node case. So it could get "more stuck" than single node case.
3) My experience with clustering also makes me easily suspect network issues as the bottleneck, but it seems there was similar fluctuation in CPU and disk access as with the earlier InnoDB purge issue, so it could very well be it. At that point I'm driving quite a lot of traffic, after all.
Yes. sysbench is on a separate machine and connects via eth0, and the galera cluster communication connects via eth1 - I hope. I don't know for sure, but at least I use that hostname for the gcomm:// address, so I was hoping they self-discover that network then?
The thing is that with
The thing is that with sysbench I still only have a set number of client connections, so if InnoDB blocks all of them at purge phase, they will be equally blocked.
Well, we saw from the slave processlist that blocking one applier on delete didn't prevent other appliers from finishing their jobs "on time". I'm quite puzzled how IO can block a single thread (and for so long!) without blocking others - but apparently this is what is happening. And maybe it is a clue to the responsible InnoDB parameter.
So it could get "more stuck" than single node case.
That's an excellent point. Now I'm pretty much convinced that your initial conclusions are correct, If you look at a single server results, InnoDB just fails to scale past 64 writing threads... That makes me wonder if InnoDB was ever tested with such sysbench transaction rate, since it is possible only thanks to turning off all "safety" settings and without Galera such setup would be impractical (or, rather, unsuitable for production). The figures I saw were all around several hundred.
Yes. sysbench is on a separate machine and connects via eth0, and the galera cluster communication connects via eth1 - I hope. I don't know for sure, but at least I use that hostname for the gcomm:// address, so I was hoping they self-discover that network then?
Well, you know, Linux kernel advertises all IPs at all interfaces and by default Galera binds to all interfaces, so if you have both eth0 and eth1 plugged into the same router, things can happen, but normally they don't. If you want to be absolutely sure about it setting gmcast.listen_addr used to force binding to a specific interface. Normally it should not have much effect since as we saw in case of sysbench, replication traffic (in packets) is 20x less than the client one.
Historically it was common
Historically it was common that MySQL performance "dies" with an increasing number of sysbench threads. This situation is improved in MySQL 5.5, where it stays more flat after peaking.
Well, looking at your results
Well, looking at your results it does not die that much with safety settings on. It just never goes above 600. Without syncs, however, it plunges down rather abruptly after 64 clients, and then equally abruptly it levels up at 256. I understand gradual performance degradation with increasing number of clients, but this trend looks pretty unnatural to me. I'd check how
innodb_thread_concurrency=64could help here, coz it clearly works much better with this number of threads.Which reminds me that, speaking of scalability, 3-node Galera cluster in your benchmarks more than quadruples the performance of a standalone server with production settings, and at the same time provides higher availability ;)
Btw, I think I did a tcpdump
Btw, I think I did a tcpdump last week to confirm there at least is traffic on the cluster-internal network I wanted Galera to use.
Now this looks suspiciously familiar
Oracle boasts performance improvements in MySQL Enterprise Server:
Configuration
* MySQL 5.5.16
* Oracle Linux 6.1, Unbreakable Kernel 2.6.32
* 2 sockets, 24 cores, 2 X 12-core
* Intel(R) Xeon(R) X5670 2.93GHz CPUs
* 72GB DDR3 RAM
* 2 X LSI SCSI Disk (MR9261-8i) (597GB)
Sadly they don't provide OLTP test parameters.
24 cores and 72Gb RAM may explain why their performance cut off is at 256 connections as opposed to 128 here (but the peak is still at 32).
Anyway, the point is that
* this seems to be a bug in MySQL
* it is likely related to a number of threads concurrently accessing InnoDB
* we will hardly see an official fix in the OS version
log purging still a problem in 5.5
And on the topic of purging the innodb redo log, Vadim says it didn't get any better in MySQL 5.5 either: http://www.mysqlperformanceblog.com/2011/09/18/disaster-mysql-5-5-flush…
Someone's going to have to fix that though.